Troubleshooting
Diagnose and resolve common issues with the AgentUX plugin, WebSocket connections, GraphRAG knowledge base, and MCP configuration.
On This Page
- Connection Issues
- Plugin Loading
- First-Time Launch
- Method Errors
- GraphRAG Issues
- MCP Configuration
- Performance
- Reading the Output Log
- Preserving Existing Neo4j Data
Connection Issues
WebSocket connection refused
Symptom: Client receives "connection refused" when connecting to ws://localhost:9877.
Cause: The AgentUX plugin is not loaded, the editor is not running, or the WebSocket server failed to bind to port 9877.
Solution:
- Confirm the Unreal Editor is running and the AgentUX plugin is enabled in Edit > Plugins.
- Check the Output Log (Window > Output Log) for
LogAgentUXmessages. A successful startup shows:LogAgentUX: WebSocket server listening on port 9877 - Verify the port is open:
netstat -an | findstr 9877 - If no output appears, the plugin did not start. See the Plugin Loading section below.
Port 9877 already in use
Symptom: Output Log shows a bind error, or a second editor instance fails to start the WebSocket server.
Cause: Another process (often a previous editor instance) is already bound to port 9877.
Solution:
- Find the process holding the port:
netstat -ano | findstr 9877 - Identify the PID in the last column and check if it is another editor instance.
- Close the other editor, or terminate the process if it is stale:
taskkill /PID <pid> /F - Restart the editor. Only one instance of the AgentUX WebSocket server can bind to port 9877 at a time.
Origin header rejected
Symptom: WebSocket connection is immediately closed by the server after the handshake.
Cause: The AgentUX WebSocket server requires an Origin header on all connections for security. Some clients omit it by default.
Solution: Include the Origin header in your connection request. For example, in Python:
import websockets

ws = await websockets.connect(
    "ws://localhost:9877",
    additional_headers={"Origin": "http://localhost"}
)
The MCP bridge handles this automatically. This issue only affects custom scripts or third-party clients.
Connection drops after idle timeout
Symptom: A long-running connection silently disconnects after several minutes of inactivity.
Cause: Network middleware, firewalls, or proxy software may close idle TCP connections.
Solution:
- Send periodic
agentux.pingrequests as a keepalive:{"jsonrpc": "2.0", "id": 1, "method": "agentux.ping"} - If using the MCP bridge, it manages keepalive automatically. Check that no local firewall or antivirus is interfering with localhost connections.
Plugin Loading
Plugin not appearing in Plugin Manager
Symptom: AgentUX does not appear under Edit > Plugins in the editor.
Cause: The plugin folder is in the wrong location for your build type.
Solution:
- Retail / Epic Games Launcher build: Place the plugin in your project directory:
<YourProject>/Plugins/AgentUX/ - Source build: Place the plugin in the engine directory:
<UE Root>/Engine/Plugins/Experimental/AgentUX/
Verify that the folder contains AgentUX.uplugin at the top level. Restart the editor after moving the plugin.
Missing binary files after build
Symptom: The plugin appears in the Plugin Manager but fails to load, with errors about missing DLLs.
Cause: The build did not produce binaries, or the build configuration was incorrect.
Solution:
- Close the editor completely before building.
- Run the build command from the engine root:
Engine/Build/BatchFiles/Build.bat UnrealEditor Win64 Development -Module=AgentUX - Confirm that
Binaries/Win64/contains.dlland.modulesfiles after the build completes. - For retail builds, ensure
"Installed": trueis set inAgentUX.upluginso the engine uses pre-compiled binaries.
.uproject plugin reference not working
Symptom: The editor ignores the plugin entry in the .uproject file.
Cause: The JSON structure is malformed or the plugin name does not match exactly.
Solution: Verify the plugin entry uses the exact name AgentUX (case-sensitive):
{
  "Plugins": [
    { "Name": "AgentUX", "Enabled": true }
  ]
}
Check for JSON syntax errors (trailing commas, missing brackets). The editor silently ignores malformed plugin entries.
Plugin version mismatch with engine version
Symptom: The plugin loads but logs warnings about version incompatibility, or methods behave unexpectedly.
Cause: The plugin binary was compiled against a different engine version.
Solution:
- Use
agentux.pingto verify the reported engine version:
The response includes{"jsonrpc": "2.0", "id": 1, "method": "agentux.ping"}ue_versionandplugin_version. - Rebuild the plugin from source against your current engine version if the versions do not match.
- For retail builds, download the binary package that matches your engine version.
First-Time Launch
Water Body Collision profile warning
Symptom: On the first editor launch after installing AgentUX, a warning dialog appears:
Collision Profile settings do not include an entry for the Water Body Collision profile, which is required for water collision to function.
Cause: AgentUX includes a Water System handler that references the Water plugin's collision profile. If your project has not used the Water plugin before, the collision profile entry does not exist in your project's DefaultEngine.ini.
Solution:
- The warning dialog has a clickable link on the right side that reads "Add entry to DefaultEngine.ini?". You may need to scroll the dialog to the right or widen the window to see it.
- Click that link. The editor automatically adds the required collision profile entry to your project's
DefaultEngine.ini. - Click Clear at the bottom of the Output Log to dismiss the message, or click the X at the top right to close the window.
- The warning will not appear again after the entry has been added.
This is a one-time setup step. It does not affect your project unless you use the Water system. The collision profile entry is harmless if unused.
Method Errors
"Method not found" responses
Symptom: The server returns a JSON-RPC error with code -32601 ("Method not found").
Cause: The method name is misspelled, uses the wrong case, or is missing the namespace prefix.
Solution:
- List all available methods:
{"jsonrpc": "2.0", "id": 1, "method": "agentux.methods.list"} - All methods use
namespace.methodformat. For example:editor.state.getSelection, notgetSelection. - Method names are case-sensitive.
editor.state.getselectionwill not work. - If using Claude through the MCP bridge, Claude automatically discovers available methods. If calling directly, always verify names against the method list first.
Parameter validation failures
Symptom: Error response with code -32602 ("Invalid params") even though the method name is correct.
Cause: Required parameters are missing, or parameter types do not match the expected schema.
Solution:
- Check the API Reference for the exact parameter names and types for that method.
- Ensure all required fields are present in the
paramsobject. - Verify type correctness: string IDs must be strings (not integers), coordinates must be numbers (not strings), and boolean flags must be
true/false(not1/0).
Safety guard rejections
Symptom: A mutating method returns an error indicating the operation was blocked by a safety guard.
Cause: Certain operations are blocked when the editor is in a state that could cause data loss or crashes, such as during Play-In-Editor (PIE) sessions or garbage collection.
Solution:
- Check the current safety status:
{"jsonrpc": "2.0", "id": 1, "method": "agentux.safety.status"} - If PIE is running, stop the play session before attempting editor mutations (spawning actors, modifying properties, etc.).
- If GC is in progress, wait a moment and retry. Garbage collection typically completes in milliseconds.
- Read-only methods (queries, state inspection) are never blocked by safety guards.
Timeout on long operations
Symptom: No response received within the expected time for operations like building lighting or importing large assets.
Cause: Some editor operations are inherently slow (lighting builds can take minutes). The default client timeout may be too short.
Solution:
- Increase your client-side timeout for known slow operations. The server does not time out: it will respond when the operation completes.
- For batch requests, avoid mixing fast queries with slow operations in the same batch. Send slow operations individually.
- Monitor progress via the Output Log for operations like
editor.build.lighting.
GraphRAG Issues
Neo4j not running or not reachable
Symptom: GraphRAG MCP tools return connection errors referencing bolt://localhost:7687.
Cause: The Neo4j server is not running, or it has not finished starting (the JVM takes several seconds to boot).
Solution:
- Check Neo4j status:
neo4j status - If stopped, start it:
neo4j start - Wait for the bolt port to accept connections (cold start takes approximately 5.5 seconds):
netstat -an | findstr 7687 - For reliable auto-start, install Neo4j as a Windows service:
neo4j install-service neo4j start - See the Installation guide for full Neo4j setup instructions.
Slow first query
Symptom: The first semantic search takes 15-20 seconds, while subsequent queries complete in under a second.
Cause: The ONNX embedding model (~600 MB) is lazily loaded on the first semantic query. This is by design to avoid slowing down MCP server startup.
Solution:
- This is expected behavior. After the one-time load, every subsequent query completes in approximately 300 ms.
- If the OS file cache is warm (model was loaded in a previous session), the cold start drops to approximately 4 seconds.
- Structural graph queries (
get_class_details,get_class_hierarchy, etc.) do not use embeddings and are fast from the start (4-45 ms).
Stale data after engine update
Symptom: GraphRAG returns information about classes, properties, or modules that no longer exist or are missing newly added ones.
Cause: The knowledge base was built against a previous engine version and needs to be re-indexed.
Solution: Rebuild the knowledge base to reflect your current engine source:
python install.py --skip-depsThis reconfigures credentials, restores the knowledge base, and validates the embedding model. See the GraphRAG Guide for details on the rebuild process.
LanceDB index corruption
Symptom: Vector search returns errors, empty results, or crashes with file-related exceptions.
Cause: The LanceDB vector index files were corrupted, possibly from an interrupted write or disk issue.
Solution:
- Delete the LanceDB data directory:
rm -rf <AgentUX>/GraphRAG/lancedb_data/ - Re-run the installer to rebuild the vector index:
python install.py --skip-deps - Verify by running a semantic search query through Claude or the MCP tools.
MCP Configuration
Claude Code not discovering MCP tools
Symptom: Claude does not offer AgentUX or GraphRAG tools when prompted about Unreal Engine tasks.
Cause: The MCP server configuration is not in the expected location, or the config file has syntax errors.
Solution:
- Verify the configuration file exists at one of these paths:
- Project-level:
<YourProject>/.claude/settings.json - User-level:
~/.claude/settings.json
- Project-level:
- Confirm the
mcpServerssection includes both theagentuxandue-graphragentries (or justagentuxfor editor-only mode). See the Installation guide for the exact format. - Restart Claude Code after editing the configuration. MCP settings are read at startup.
MCP server process not starting
Symptom: Claude Code reports that the MCP server failed to start or timed out during initialization.
Cause: The Python or Node.js environment is not configured correctly, or the server script path is wrong.
Solution:
- Verify that
pythonis on your PATH and is version 3.10+:python --version - Test the bridge server manually:
It should start without errors and wait for MCP messages on stdin.python <path-to>/AgentUX/Bridge/agentux_mcp_bridge.py - If using Bridge v2 (Agent SDK), verify Node.js 20+ is installed:
node --version - Ensure all paths in the MCP config use forward slashes or properly escaped backslashes.
Environment variable issues
Symptom: GraphRAG MCP server starts but cannot connect to Neo4j, or reports missing configuration.
Cause: Required environment variables are missing or point to wrong values.
Solution: Verify the following variables are set in the MCP config's env block:
GRAPHRAG_CONFIG: must point to the absolute path ofconfig.yamlinside the AgentUX GraphRAG directory.
If Neo4j uses non-default credentials, ensure the config.yaml file contains the correct values for NEO4J_URI, NEO4J_USER, and NEO4J_PASSWORD. Running python install.py --skip-deps will auto-detect and write these values.
Editor-only vs full config differences
Symptom: Some AgentUX tools work (editor control) but GraphRAG tools are unavailable, or vice versa.
Cause: The MCP configuration only includes one of the two servers.
Solution:
- Editor control only requires the
agentuxMCP server entry: this provides 662 editor methods. - GraphRAG knowledge requires the
ue-graphragMCP server entry: this provides 33 search/lookup tools. - For full functionality, include both entries. The bridge auto-detects whether GraphRAG is available and exposes a
graphrag_statustool for runtime connectivity checks.
Performance
Cold start times
Symptom: The first WebSocket connection after launching the editor takes noticeably longer than subsequent ones.
Cause: The WebSocket server binds during StartupModule() in approximately 2.5 ms, but the first connection may trigger lazy initialization of certain handler subsystems.
Solution:
- Plugin startup is extremely fast (~3.4 ms total) and should be imperceptible. If you experience multi-second delays, check for other plugins or project-level initialization competing for resources.
- The WebSocket server has zero background resource usage until a client connects: there is no dedicated thread.
- Send an
agentux.pingas your first message to warm up the connection before issuing real commands.
Embedding model load time
Symptom: The first GraphRAG semantic search takes approximately 18 seconds.
Cause: The ONNX embedding model (~600 MB) loads on the first semantic query. This is a one-time cost per MCP server session.
Solution:
| Scenario | First Query | Subsequent Queries |
|---|---|---|
| Cold start (first session) | ~18s | <300ms |
| Warm OS cache (repeat session) | ~4s | <300ms |
| Structural queries (no embedding) | 4-45ms | 4-45ms |
Structural queries (get_class_details, get_class_hierarchy) bypass the embedding model entirely and are fast from the start.
Large batch request timeouts
Symptom: A batch of many requests times out or takes significantly longer than expected.
Cause: Batch requests are processed sequentially on the editor tick. A batch containing slow operations blocks subsequent items.
Solution:
- Keep batches to fast, read-only operations for best performance:
[ {"jsonrpc": "2.0", "id": 1, "method": "agentux.ping"}, {"jsonrpc": "2.0", "id": 2, "method": "editor.state.getSelection"}, {"jsonrpc": "2.0", "id": 3, "method": "editor.state.getWorldInfo"} ] - Send slow mutating operations (lighting builds, large imports) as individual requests with extended client-side timeouts.
- The MCP bridge handles batching automatically: this is primarily relevant for direct WebSocket integrations.
Memory usage with many concurrent connections
Symptom: Editor memory usage increases significantly when multiple WebSocket clients are connected.
Cause: Each connection maintains its own message buffer and handler state.
Solution:
- In normal usage (1-3 concurrent connections), memory overhead is negligible.
- If you are running automated test suites with many parallel connections, close idle connections promptly.
- The WebSocket server is pumped via the editor tick loop. Excessive concurrent connections may reduce editor frame rate. Limit concurrent clients to what your workflow requires.
Reading the Output Log
The Output Log (Window > Output Log) is the primary diagnostic tool. All AgentUX activity appears under the LogAgentUX category.
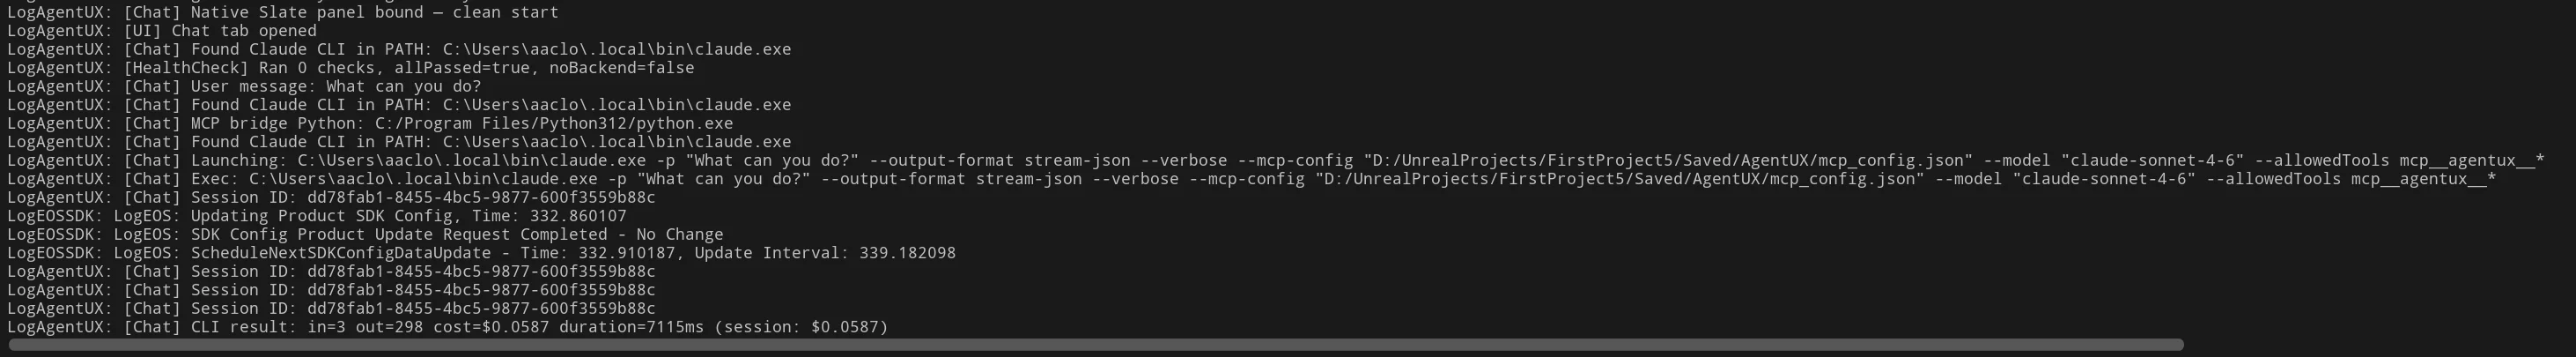
Common log patterns to look for:
LogAgentUX: [Chat] Exec:-- The Claude CLI command that was invoked, including model, output format, and MCP config pathLogAgentUX: [Chat] Session ID:-- Unique session identifier for correlating requestsLogAgentUX: [Chat] CLI result:-- Token counts, cost, and duration for the completed request
Diagnostic Quick Reference
Use these JSON-RPC calls to quickly assess the system state when troubleshooting:
| Command | Purpose |
|---|---|
| agentux.ping | Verify connection, plugin version, engine version |
| agentux.methods.list | List all registered methods and their namespaces |
| agentux.safety.status | Check safety guard state (PIE, GC, etc.) |
| graphrag_status | Check GraphRAG and Neo4j connectivity (via MCP) |
Preserving Existing Neo4j Data
The AgentUX installer uses neo4j-admin database import full to load its knowledge base. This command overwrites the entire neo4j database. If you have existing data in Neo4j that you want to keep, follow these steps to export it before installing and re-import it afterward.
Why does AgentUX overwrite the database? The knowledge base contains 16 million+ nodes and 22 million+ relationships. The only feasible way to load this volume of data is the offline bulk import tool (neo4j-admin import full), which requires an empty database. Cypher-based loading would take many hours and often fails with memory errors at this scale.
Good news: AgentUX data uses the :GraphRAG label on all its nodes, so it will not conflict with your existing data after re-import. Your existing applications should continue to work normally.
Step 1: Export your existing data before installing AgentUX
Use these prompts with Claude, ChatGPT, or any AI assistant that can run Cypher queries against your Neo4j instance. Copy and paste the prompt that matches your situation.
Prompt: Export all data to JSON files
I need to export all data from my Neo4j database before it gets overwritten.
The database is at bolt://localhost:7687 with user "neo4j".

Please write a Python script that:
1. Connects to Neo4j and queries all node labels (CALL db.labels())
2. For each label, exports all nodes with their properties to a JSON file
3. Exports all relationships with start/end node IDs, type, and properties
4. Saves everything to a directory called "neo4j_backup" with one file per label
5. Includes a manifest.json listing all labels, relationship types, and counts

Use the neo4j Python driver. Export nodes using elementId() as the identifier.
Save relationship endpoints as elementId references.

Important: do NOT export nodes with the :GraphRAG label -- those belong to
AgentUX and will be recreated by the installer.
Prompt: Export specific labels only
If you know which labels contain your data, this is faster:
Export all Neo4j nodes with these labels to JSON files: [YOUR_LABELS_HERE]
Also export all relationships between those nodes.
Skip any nodes labeled :GraphRAG (those belong to AgentUX).
Save to a "neo4j_backup" directory with a manifest.
Step 2: Install AgentUX normally
Run the installer as documented. The knowledge base restore will overwrite the neo4j database with AgentUX data.
python install.py --neo4j-password YOUR_PASSWORDWait for the restore to complete (about 30 minutes for Pro tier).
Step 3: Re-import your data into the restored database
After AgentUX installation completes, use this prompt to re-import your backed-up data:
Prompt: Re-import backed up data
I backed up my Neo4j data to a "neo4j_backup" directory before installing
AgentUX. The database now contains AgentUX data (nodes with :GraphRAG label).

Please write a Python script that:
1. Reads the manifest.json from my neo4j_backup directory
2. For each label, reads the JSON file and creates nodes via Cypher
3. Uses MERGE (not CREATE) so existing nodes are not duplicated
4. After all nodes are created, imports all relationships using MERGE
5. Reports counts of nodes and relationships created vs skipped

Important rules:
- Use MERGE with the node's natural key properties to avoid duplicates
- Process in batches of 1000 for performance
- Do NOT touch any nodes with the :GraphRAG label
- Connect to bolt://localhost:7687 with user "neo4j"

My backup contains these labels: [LIST FROM MANIFEST]
Step 4: Verify everything works
Please verify my Neo4j database after re-importing my data:

1. Count all nodes grouped by label (CALL db.labels() then count each)
2. Confirm my labels [YOUR_LABELS] have the expected counts from the backup manifest
3. Confirm :GraphRAG nodes exist (these are AgentUX data)
4. Run a sample query from my application to verify it still works
5. Check for any broken relationships (relationships pointing to missing nodes)
How the AgentUX restore works (technical details)
Understanding the restore process helps when troubleshooting coexistence issues:
- CSV Conversion (~15 min): The installer converts the compressed knowledge dump (
.jsonl.gz) into CSV files thatneo4j-admincan read. Node IDs are version-qualified strings likeUClass:Engine:APlayerController:5.7.2. - Neo4j Stop: The Neo4j service is stopped (required for offline import).
- Bulk Import (~11 min):
neo4j-admin database import fullwrites directly to the database store files, bypassing the transaction engine. This is why it overwrites existing data. - Neo4j Restart: The service is restarted with the new data.
- Index Creation (~2 min): Constraints, indexes, and fulltext search indexes are created via Cypher.
- Cleanup (~5 min): Temporary import IDs (
_stable_id) are removed from nodes. - Verification: Node and relationship counts are checked against the dump manifest.
All AgentUX nodes carry the :GraphRAG label. Your re-imported data will use different labels, so there is no collision. Existing applications that query by their own labels will continue to work as before.
Neo4j Community Edition limitation
Neo4j Community Edition supports only one database (neo4j). If you had Neo4j Enterprise Edition, you could create a separate database for AgentUX. Community users must share the single database, which is why the export/re-import workflow is necessary.
Handler Unavailable (-32001)
Symptom: Calling a method returns error code -32001 with a message like "MovieRenderPipeline plugin is not enabled."
Cause: Some AgentUX handlers depend on optional UE plugins. If the plugin is not enabled, the handler returns -32001 instead of crashing.
Solution: Enable the required plugin in Edit > Plugins, then restart the editor.
| Handler | Required Plugin | Plugin Category |
|---|---|---|
| editor.sequencer | Level Sequence Editor | Cinematic |
| editor.niagara | Niagara | FX |
| editor.rc | Remote Control | Virtual Production |
| editor.pcg | PCG | Procedural |
| editor.render | Movie Render Pipeline | Rendering |
| editor.statetree | State Tree | AI |
| editor.metasound | MetaSound | Audio |
| editor.water | Water | Experimental |
| editor.vegetation | Procedural Vegetation Editor | Experimental |
All other handlers (actor, material, blueprint, asset, level, viewport, etc.) are always available with no additional plugins required.
Version-Specific Features
Symptom: A method returns an error saying "requires UE 5.7+" or is not listed by agentux.methods.list.
Cause: AgentUX supports UE 5.6 and 5.7. Some advanced features use APIs that are only available in UE 5.7+. On 5.6, those methods are excluded and the handler returns a clear version error.
| Feature | UE 5.7+ | UE 5.6 |
|---|---|---|
| Total methods | 662 | 577 |
| Sequencer scripting (keyframes, channels, playback) | 27 methods | 6 methods (basic tracks/sections) |
| PCG editor (graph editor control, debug, panel) | 90 methods | 42 methods (graph CRUD, nodes, params) |
| Vegetation (Megaplants) | 12 methods | Not available |
| StaticMesh (Nanite ShapePreservation) | 18 methods | 16 methods |
| StateTree (getExtensions) | 6 methods | 5 methods |
| MeshPaint (swapVertexColors) | 8 methods | 7 methods |
This is expected behavior, not an error. All core handlers (actor, blueprint, material, asset, level, viewport, landscape, and 30+ others) have full functionality on all supported versions. Upgrade to UE 5.7+ for the complete feature set.
Still Stuck?
- Check the Installation page for setup requirements and step-by-step instructions.
- Review the Getting Started guide for a working end-to-end walkthrough.
- Consult the GraphRAG Guide for knowledge base tool reference and query patterns.
- Search the Output Log for
LogAgentUXmessages: the plugin logs detailed diagnostics at startup and on errors.